Blog
sheet Week 13:
This week’s blog sheet will be both individual and group.
Your blogsheet 13 tasks:
Daniel's Rube Goldberg
1. Provide the updated computer drawing for your individual RG setup.
2. Explain your setup.
The circuit is triggered by knocking a ball down a ramp to
push a small domino off of the photocell resistor. When the photocell receives
more light the resistance is lower and is hooked up to a non inverting OPAMP.
The photocell is R1 in the gain equation ( R2/R1 + 1 = gain). When the gain is
increased the OPAMP outputs about 7 volts to the magnetic coil in a relay which
switches the incoming 5 volts through pin 1 of the relay from pin 4 to pin 3.
Pin 3 is connected as an input to the 555 timer which has its output connected
to the 74192 BCD. Qa and Qd of the 74192 is connected to an AND gate and also a
7447 display driver and that is connected to a 7 segment display. So the
display will count from 0 to 9. When the 74192 is 9 Qa and Qd are 1 and will
output to another OPAMP which will power a transistor on. The transistor will
provide power to a DC motor with a propeller connected to it. This propeller
will blow air at a domino and the domino will fall on a cylinder which will
roll down a ramp knocking a ball onto force sensing resistor which will trigger
Moaad’s circuit.
3. Provide photos of the circuit and setup.


Image 3.1 Rube Goldberg breadboard photo, ramp removed
Image 3.2 Rube Goldberg, white light indicates it is ready
Image 3.3 Rube Goldberg, finish to next Rube Goldberg
Image 3.4 Rube Goldberg, motor and fan
Image 3.5 Rube Goldberg, starting portion
4. Provide at least 2 new videos of your setup in action, one being a failed attempt.
Video 4.1 Failed Attempt of Rube Goldberg
Video 4.2 Successful Attempt of Rube Goldberg
5. What failures did you have? How did you overcome them?
My Rube Goldberg had
a couple of physical reliability problems. The domino that sits on top of the
photocell would not sit on top of the photocell very well, and also the ball
that initially triggers my circuit was rolling and hitting the second ramp causing
the cylinder to roll down prematurely. So I just bent the photocell wires to
stand up straight and I moved the second ramp out of the way so the ball would
not hit it, it has become very reliable at this point.
There were a couple of times the ball would not knock the domino off the photocell resistors. So I would have to reposition the ramp and the photocells to allow the domino the fall of the photocells easier.
Moaad's Rube Goldberg
1. Provide the updated computer drawing for your individual RG setup.

2. Explain your setup.
The circuit will start with a force sensing resistor that will get some load from my partner then the output is going to the 555 timer which gives the output to 74192 which send to the 7447. The 7 segment display will start counting. When it reach to 9 the motor will turn in by the AND gate which is prepared to. The motor will start the race by hitting a car and the car will be bombing a balloon at the end. The car will go through a racetrack. Another motor that will hit the car when the 7-segment display shows zero again. This car will take care of stopping the circuit by taking of the load of the force sensing resistor.
3. Provide photos of the circuit and setup.
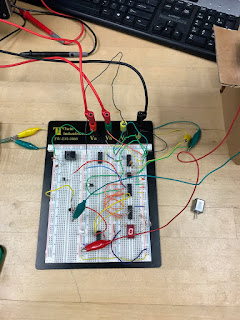

Image 3.2 the mechanical part set up.

Image 3.3 555-timer.

Image 3.4 Force sensing resistor.

Image 3.5 XOR gate, motor, and 7-segment display.
4. Provide at least 2 new videos of your setup in action, one being a failed attempt.
5. What failures did you have? How did you overcome them?
My biggest struggle in the class is when resistors touching each other. I take an hour trying to find the problem and then finally it was just two resistor touching each other. I overcome them by putting them away from each other, or put a small piece of paper between them as somebody in the class told me.
Other two failures and I'm still trying to overcome them are make 7-segment display counts and get enough current to the motor. I overcome these problems by using a transistors to get enough current to the motor.

1.1 computer drawing.
2. Explain your setup.
The circuit will start with a force sensing resistor that will get some load from my partner then the output is going to the 555 timer which gives the output to 74192 which send to the 7447. The 7 segment display will start counting. When it reach to 9 the motor will turn in by the AND gate which is prepared to. The motor will start the race by hitting a car and the car will be bombing a balloon at the end. The car will go through a racetrack. Another motor that will hit the car when the 7-segment display shows zero again. This car will take care of stopping the circuit by taking of the load of the force sensing resistor.
3. Provide photos of the circuit and setup.

Image 3.1 the set up all together.

Image 3.2 the mechanical part set up.

Image 3.3 555-timer.

Image 3.4 Force sensing resistor.

Image 3.5 XOR gate, motor, and 7-segment display.
4. Provide at least 2 new videos of your setup in action, one being a failed attempt.
Video 4.1 fails attempt.
For the video the racetrack slow down the car which does not make the car fast enough to bomb the balloon.
Video 4.1 another attempt.
5. What failures did you have? How did you overcome them?
My biggest struggle in the class is when resistors touching each other. I take an hour trying to find the problem and then finally it was just two resistor touching each other. I overcome them by putting them away from each other, or put a small piece of paper between them as somebody in the class told me.
Other two failures and I'm still trying to overcome them are make 7-segment display counts and get enough current to the motor. I overcome these problems by using a transistors to get enough current to the motor.
6. Group
task: Explain your group RG setup.
The group RG setup is started with Daniel's RG which is explained above. When the cylinder rolls down the ramp and knocks a wooden ball onto a force sensing resistor this lowers the resistance to Moaad's 555 timer. This begins Moaad's circuit which is explained above. Moaad's circuit finishes off with the car rolling down the cardboard tube which will provide a transition to the next group RG. It is also important to note that our power supply setup has two channels of DC voltage. One circuit provides 5 volts while the other provides 10.25 volts, we did notice that our circuits needed to be set precisely to these values for the circuit to work reliably.


The group RG setup is started with Daniel's RG which is explained above. When the cylinder rolls down the ramp and knocks a wooden ball onto a force sensing resistor this lowers the resistance to Moaad's 555 timer. This begins Moaad's circuit which is explained above. Moaad's circuit finishes off with the car rolling down the cardboard tube which will provide a transition to the next group RG. It is also important to note that our power supply setup has two channels of DC voltage. One circuit provides 5 volts while the other provides 10.25 volts, we did notice that our circuits needed to be set precisely to these values for the circuit to work reliably.


Image 6.1 Daniel's setup.


Image 6.2 Moaad's setup.

Image 6.3 the whole setup.
7. Group
task: Video of a test run of your group RG.
Video 7.1 testing our RG.