Blog Sheet Week 6


b. Apply 0 V to the non-inverting input. Sweep the inverting input (Vin) from -5 V to 5 V with 1 V steps. Take more steps around 0 V (both positive and negative). Create a table for Vin and Vout. Plot the data (Vout vs Vin). Discuss your results. What would be the ideal plot?

Table 1.2 Open loop configuration OPAMP input and output voltage inverting


Table 2.1 OPAMP gain of 3, input and output voltage non-inverting


Table 3.1 OPAMP gain of 3, input and output voltage inverting


We were not able to show the operation of the temperature sensor, but we hypothesize that the temperature sensor varies in resistance with a change in temperature. This would affect the Vin and Vout of the OPAMP which would energize or turn the relay off, turning the led on and off.
Operational Amplifiers

1. You will use the OPAMP in “open-loop” configuration in this part, where input signals will be applied directly to the pins 2 and 3.
a. Apply 0 V to the inverting input. Sweep the non-inverting input (Vin) from -5 V to 5 V with 1 V steps. Take more steps around 0 V (both positive and negative). Create a table for Vin and Vout. Plot the data (Vout vs Vin). Discuss your results. What would be the ideal plot?
When we applied the lowest possible voltage (Vin) we still achieved the maximum Vout. This was due to the fact that we connected the OPAMP in open loop configuration. The ideal Plot would look very much like a digital signal with -3.79 Vout with any negative Vin, and 3.79 Out with any positive Vin.
When we applied the lowest possible voltage (Vin) we still achieved the maximum Vout. This was due to the fact that we connected the OPAMP in open loop configuration. The ideal Plot would look very much like a digital signal with -3.79 Vout with any negative Vin, and 3.79 Out with any positive Vin.

Table 1.1 Open loop OPAMP configuration input and output voltages non-inverting

Graph 1.1 Open loop OPAMP configuration input and output voltages non-inverting

Table 1.2 Open loop configuration OPAMP input and output voltage inverting

Graph 1.2 Open loop configuration OPAMP input and output voltage inverting
2. Create a non-inverting amplifier. (R2 = 2 kΩ, R1 = 1 kΩ). Sweep Vin from -5 V to 5 V with 1 V steps. Create a table for Vin and Vout. Plot the measured and calculated data together.

Table 2.1 OPAMP gain of 3, input and output voltage non-inverting

Graph 2.1 OPAMP gain of 3, input and output voltage non-inverting
3. Create an inverting amplifier. (Rf = 2 kΩ, Rin = 1 kΩ). Sweep Vin from -5 V to 5 V with 1 V steps. Create a table for Vin and Vout. Plot the measured and calculated data together.

Table 3.1 OPAMP gain of 3, input and output voltage inverting

Graph 3.1 OPAMP gain of 3, input and output voltage inverting
4. Explain how an OPAMP works. How come is the gain of the OPAMP in the open loop configuration too high but inverting/non-inverting amplifier configurations provide such a small gain?
The OPAMP takes a set voltage (say 5 volts) and also takes a variable input voltage (-5 to +5 volts) and outputs a voltage equal to the gain multiplied by the variable input voltage; also if set up as inverting amp, it can output a voltage with the opposite sign. So input of +5V would give output of -5V. The theoretical maximum amplitude is the set voltage (5 volts). But realistically is a little lower than the set voltage. In open loop configuration the gain is theoretically infinite, but really it is still very high around (10^5). In inverting/non-inverting configurations the gain is reduced with the use of resistors to reduce the voltage being fed back into the input.


schematic view is the bottom view!
1. Connect your DC power supply to pin 2 and ground pin 5. Set your power supply to 0V. Switch your multimeter to measure the resistance mode; use your multimeter to measure the resistance between pin 4 and pin 1. Do the same measurement between pin 3 and pin 1. Explain your findings (EXPLAIN).
The resistance between pin 1 and 3 with 0 Volts at pin 2 resulted in almost no resistance (about .6 ohms). When connecting the multimeter to pin 4 and 1 with 0 volts at pin 2, we measured an "overlimit" reading, which means it was open and there was no connection. So the resting position of the relay is pin 1 and 3 are connecting and when the relay is switched pin 1 and 4 are connected.
The resistance between pin 1 and 3 with 0 Volts at pin 2 resulted in almost no resistance (about .6 ohms). When connecting the multimeter to pin 4 and 1 with 0 volts at pin 2, we measured an "overlimit" reading, which means it was open and there was no connection. So the resting position of the relay is pin 1 and 3 are connecting and when the relay is switched pin 1 and 4 are connected.
2. Now sweep your DC power supply from 0V to 8V and back to 0V. What do you observe at the multimeter (resistance measurements similar to #1)? Did you hear a clicking sound? How many times? What is the “threshold voltage values” that cause the “switching?” (EXPLAIN with a VIDEO).
Video 2.1 Showing the operation of the relay with varying voltages
We noticed there were two audible clicks from the relay, 1st one was around 3V and the second usually occured around 6- 6.5 volts.
3. How does the relay work? Apply a separate DC voltage of 5 V to pin 1. Check the voltage value of pin 3 and pin 4 (each with respect to ground) while switching the relay (EXPLAIN with a VIDEO).
Video 3.1 Shows the relay output change the switching the relay
We noticed that the output of volts at pin 1 changed when the relay was "switched".
LED + Relay
1. Connect positive end of the LED diode to the pin 3 of the relay and negative end to a 100 ohm resistor. Ground the other end of the resistor. Negative end of the diode will be the shorter wire.
2. Apply 3 V to pin 1
3. Turn LED on/off by switching the relay. Explain your results in the video. Draw the circuit schematic (VIDEO)
Video 3.1 Relay controlled LED switching on and off
Operational Amplifier (data sheet under Bb/week 6)
1. Connect the power supplies to the op-amp (+10V and 0V). Show the operation of LM 124 operational amplifier in DC mode with a non-inverting amplifier configuration. Choose any opamp in the IC. Method: Use several R1 and R2 configurations and change your input voltage (voltages between 0 and 10V) and record your output voltage. (EXPLAIN with a TABLE)
We were able to change the gain on the OPAMP by changing the resistance value ratio of R2 to R1. In the first table we achieved a gain of 3 ( 2000/1000 + 1 = 3 ), and the second table a gain of 5 ( 2000/470 + 1 = about 5 ).


We were able to change the gain on the OPAMP by changing the resistance value ratio of R2 to R1. In the first table we achieved a gain of 3 ( 2000/1000 + 1 = 3 ), and the second table a gain of 5 ( 2000/470 + 1 = about 5 ).

Table 1.1 OPAMP non-inverting Vin and Vout values gain of 3
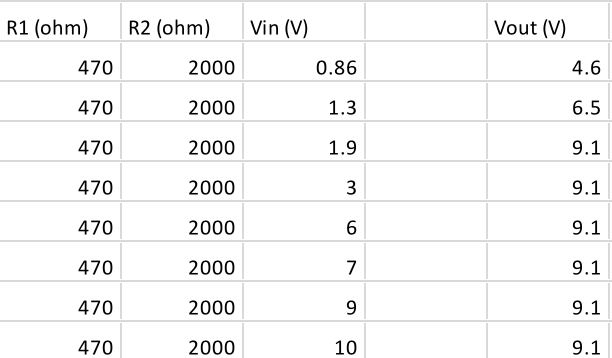
Table 1.2 OPAMP non-inverting Vin and Vout values gain of 5
2. Use your temperature sensor as your input. Do you think you can generate enough voltage to trigger the relay? (EXPLAIN)
We assume we would be able to generate enough voltage to trigger the relay with a heat source (hair dryer). Our hypothesis was that increasing temperature of the temp sensor would decrease the resistance of the sensor allowing enough voltage to flow to the relay.
We assume we would be able to generate enough voltage to trigger the relay with a heat source (hair dryer). Our hypothesis was that increasing temperature of the temp sensor would decrease the resistance of the sensor allowing enough voltage to flow to the relay.
3. Design a system where LED light turns on when you heat up the temperature sensor. (CIRCUIT schematic and explanation in a VIDEO)
We were not able to show the operation of the temperature sensor, but we hypothesize that the temperature sensor varies in resistance with a change in temperature. This would affect the Vin and Vout of the OPAMP which would energize or turn the relay off, turning the led on and off.
4. BONUS! Show the operation of the entire circuit. (VIDEO)
in questions #2 and #3 we got different graph i think you might get a wrong values for the Vin and Vout, because we got the reverse of your graph
ReplyDeleteYes after looking to other blogs I can tell that there is something wrong.
DeleteThanks.
The only thing that stands out as different is your graph 2.1. Out outputs were the opposite as yours. Maybe look into seeing if your values were put wrong cause most of the blogs I have seen has it opposite of what you do. Overall, very good though, I love the look of your tables and graphs.
ReplyDeleteYea when I checked the other blogs I saw the difference. I guess our values were entered incorrectly.
DeleteThank you.
Good blog! Videos are good, I like how they start out with Daniel. It reminds me of Mr. Rogers "Hello neighbor, today we are going to talk about Relays..."
ReplyDeleteBack to a more serious note. I would recommend changing the X axis of the graphs in 2 and 3. At first glance it looks like its the same graph. However, the graph in one is ascending X axis, and descending in the other. It's just counter intuitive to see numbers go from 5 to -5. But other than that superficial issue, great blog.
Yea you are right. If we noticed that earlier we would be able to change it.
DeleteThanks.
For Question 2 (Non-inverting amp), Our group got consistently smaller reading than yours did by about .4 mA even though the input values were quite similar. Not sure if this could have been from a problem with our multimeter or a bad connection somewhere in our circuit.
ReplyDeleteIt could be. I realize the same thing with other groups. I think that is normal.
DeleteThanks.
It was a little confusing because for your graphs for numbers 2 and 3 they were Vin vs Vout as apposed to Vout vs Vin like your graphs for number 1. Your videos were well done and explain things nicely though.
ReplyDeleteI want to say that there were a few minor mistakes on the third and fourth graphs that were created but no big deal. Also I think there should be more consistency in your sig figs, and for the non inverting graphs show where zero is at.
DeleteI think what makes the graph looks like this is because our table was not in the correct order somehow.
DeleteThanks.
The blog is really great but the only issue is that the graph for question 2 and 3 is also hard to read them and I think that because the X-axis in Q2 start from -5 on the right but in Q3 it starts from 5V on the right which makes it really confusing. However, i liked the idea that you measured lots of voltage values to get an accurate results. good job.
ReplyDeleteI thought the problem in question number 2 and 3 is from the data, but what you said make more sense to me. I think you are right.
DeleteThanks.
Other than the two graphs for questions 2 and 3 being a little confusing your blog is really well done and your videos are well done.
ReplyDeleteI think there was something wrong with table which cause that grapgh.
DeleteThanks.
This comment has been removed by the author.
ReplyDeleteVery well done blog, I quite like the addition of the diagrams for each of the components. Graphs 2.1 and 3.1 are a bit hard to look at, due to how the x-axis was structured.
ReplyDeleteIt is the same two questions 2 and 3 that is confusing everybody. As I told the others something wrong with table in my opinion which cause that grapgh.
DeleteThanks.
I tried to compare your blogs with ours, I found that the are mostly similar results between yours and ours, also the graphs were about similar. But you have small mistake in Q# 2 and 3, where the voltage range is -5 to 5 and that mistake make your curves different.
ReplyDeleteGood job
You are right. Our graph looks different than all others graphs I saw in other blogs.
DeleteThanks
For your diagrams in the beginning I really like that your guys included every number on all of the points, it does make it easier to understand. Your explanations sound good, even the temperature sensor ones were it was difficult to answer because of the lack on a sensor.
ReplyDeleteThank you.
DeleteWell done! Don't forget to add a circuit drawing on problem 3 of the LED + Relay section
ReplyDeleteOk.
DeleteThank you.
As Alec mentioned, your graph for 2 and 3 is somewhat hard to read. The typical graph for an op-amp has Vin on the x axis and Vout on the y axis. I suppose it doesn't necassarily take away from the data, but it would be interesting (not to mention nearly symmetrical) to switch your axes.
ReplyDeleteYou are right. It is confusing for everybody, and almost all of the comments were about 2 and 3.
DeleteVery good blog this week guys! I like how you approximated the graph as close as you could to zero in order to acquire better data. The videos are very easy to understand and the setup looks very clean. The only thing is changing the x,y coordinates for your op-amp other than that great job.
ReplyDeletefor number one it took us an extra value to reach max Vout compared to you guys reaching it right away, why do you think this was? also for number 2 we had very similar values for Vout in comparison to Vin but i was wondering how you came up with the calculated Vout values? other than this we had very similar explanations for the rest of the questions. good job.
ReplyDeleteYou might have take more values between 0.05 and -0.5 which was the extra values to reach the maximum Vout. All what we did to calculate the calculated Vout values is entering the equation in Excel and it doest for every row.
DeleteThanks.
#2 plots look wrong. I wonder if your OPAMP was functioning properly.
ReplyDeleteFor number 3 im a little confused what equation you used for calulating your theoretical Vout. Why is it 6x your Vin?
ReplyDelete